From PE Ratios to Hypergrowth: How My Thinking Evolved
As a value investor, I was grounded in evaluating companies through traditional metrics , especially the P/E ratio. For a large part of my investing life, hyper-growing companies with extremely high or even negative P/E ratios completely eluded me. They simply did not “fit” my mental model of what a good investment looked like.
That perspective began to shift during my university days.
A course mate of mine introduced me to CrowdStrike back in 2019. At the time, CrowdStrike had a negative P/E ratio, which by classic value investing standards would have disqualified it immediately. Yet its underlying business was expanding rapidly—revenue growth was strong, customer adoption was accelerating, and the product was clearly becoming mission-critical for enterprises.
Fast forward to today, and CrowdStrike has delivered massive returns.
This was my first real encounter with what I now call “hidden growth investing.”
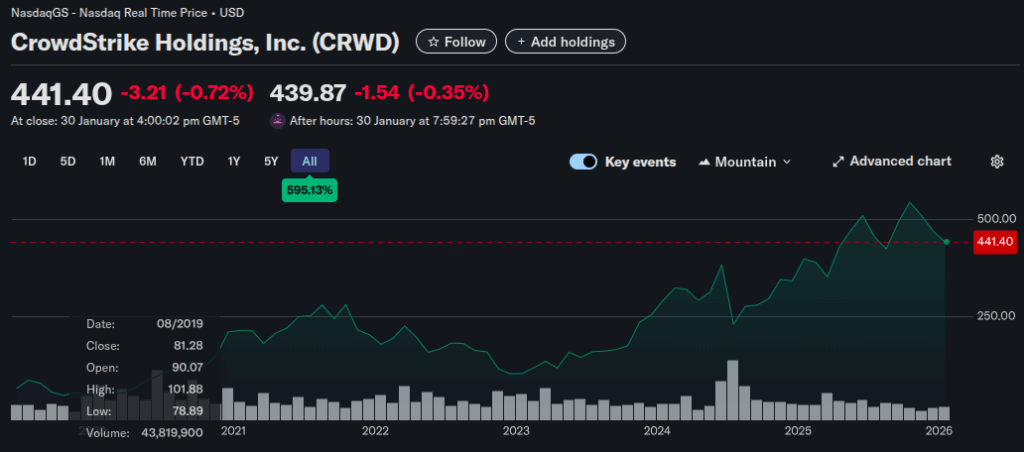
Crowdstrike price chart $50 – $441.40 – 10x bagger
Rebuilding My Investing Framework for Hypergrowth
That experience with CrowdStrike forced me to confront an uncomfortable truth: my old framework was incomplete.
Traditional value investing metrics especially P/E , work well for mature businesses with stable cash flows. But hyper-growth companies operate under a completely different objective function. They are not optimizing for current earnings. They are optimizing for scale, dominance, and long-term cash flow power.
This shift in thinking aligns closely with ideas from Zero to One by Peter Thiel, an early investor in Palantir. Thiel argues that the best businesses aim to escape competition entirely by building strong moats and becoming monopolies in their niche.
Applied to investing, this means focusing on companies that:
- Build strong business moats (high switching costs, deep integration, data advantages)
- Exhibit rapidly expanding revenue with a long runway
- Reinvest aggressively to scale before profits, even if earnings look unattractive in the short term
Negative or high P/E ratios, in this context, are not automatic red flags. The real question becomes:
Is the company burning cash or buying future dominance?
This realization became the foundation of my growth investing framework and sets the stage for the financial metrics I now use to screen for true hyper-growth businesses.
My Investing Framework for Hypergrowth
To identify hyper-growth companies early, I focus on a small set of signals that matter before earnings.
- Revenue growth first (with TAM tailwinds)|
I look for sustained 15–30%+ revenue growth over multiple years. Growth must be organic and repeatable. Just as important, the total addressable market (TAM) must be large and still expanding, ideally supported by long-term industry tailwinds.- ✅ Good example: CrowdStrike , Long runway in cybersecurity, consistent high growth, supported by structural tailwinds.
- ❌ Bad example: Groupon , Early growth looked explosive, but TAM was shallow and growth saturated quickly
- High gross margins
Strong businesses scale well. I prefer 30–80% gross margins, which signal pricing power, scalability, and long-term profitability potential.- ✅ Good example: Adobe , Consistently high margins enable reinvestment and massive free cash flow.
- ❌ Bad example: Blue Apron , Low margins capped profitability no matter how much revenue grew.
- Price-to-Sales or Price to GrossProfit over P/E
P/E is often meaningless during heavy reinvestment. Price-to-Sales (P/S) shows how much future growth the market is already pricing in.- ✅ Good example: HubSpot , Reasonable P/S relative to growth and margin profile.
- ❌ Bad example: Snowflake (at peak valuation), High P/S assumed near-perfect execution for many years.
- Operating leverage: cash flow direction
Losses don’t scare me—worsening cash burn does. Scaling a loss-making business without improving cash flow is the fastest path to bankruptcy.- ✅ Good example: Amazon (AWS era) , Heavy reinvestment early, but cash flow improved dramatically with scale.
- ❌ Bad example: WeWork . Scale increased losses and leverage, leading to collapse when capital dried up.
- Operating leverage : Strong Unit Economics
Operating leverage: strong unit economics. Good unit economics show up when gross profit scales faster than sales & marketing expense as revenue grows. Some bad examples is like- ❌ Bad example: Groupon – low retention, perpetual marketing spend, and no operating leverage.
- ❌ Bad example: Groupon – low retention, perpetual marketing spend, and no operating leverage.
- Customer retention
Retention determines whether CAC is an investment or a permanent tax. I want customers who stay longer and spend more over time.- ✅ Microsoft – enterprise customers are sticky, expand usage, and renew for years
- ❌ Blue Apron – high churn, declining cohort value, and weak repeat behavior
- Business moats
Mission-critical products, high switching costs, and deep customer lock-in matter more than short-term profits.- ✅ Good example: Microsoft , Deep enterprise lock-in and ecosystem effects protect long-term returns.
- ❌ Bad example: Peloton , Low switching costs and fad-driven demand weakened the moat.
- Shareholder dilution & insider behaviour
Growth should increasingly fund itself. Excessive dilution or runaway SBC (stock-based compensation) is a red flag, while insider buying signals confidence and alignment.- ✅ Good example: Meta , Strong cash generation limits dilution and aligns insiders with shareholders.
- ❌ Bad example: Carvana , Heavy dilution and debt were required to sustain growth.
The Graveyard of Hypergrowth: When Growth Goes Wrong
Hyper-growth is seductive. Rapid revenue expansion, massive funding rounds, and compelling narratives often convince investors that profitability will “come later.”
History shows otherwise.
This section explores hyper-growth companies that failed, not because growth slowed but because growth exposed broken economics.
Garveyard 1- Blue Apron ( Meal-kits Services )
Blue Apron grew rapidly early on, but its business collapsed because unit economics never worked and low customer retention.
- ~70% of customers churned within 4–6 months, making customer acquisition a recurring cost
- Sales & marketing stayed high as a % of revenue, showing poor retention
- Revenue per customer declined over time instead of expanding
- Most customers never reached break-even, even before overhead
Result: Growth amplified losses instead of creating leverage.
https://www.linkedin.com/pulse/detailed-look-blue-aprons-challenging-unit-economics-daniel-mccarthy/
Graveyard 2 — Groupon (Bulk-discount apps)
Groupon also grew rapidly during the 2009 after the economic crisis and discount oriented service took off. It became a constant need to subsided customers for growth.
- Explosive early growth
- Transactional, low-retention customers
- Constant promotions required to drive demand
- Sales & marketing scaled with revenue
- Gross profit never outpaced acquisition costs
Graveyard 3 – Wework ( Flexible office space)
Wework scaled with bad cashflow.
- Explosive top-line growth driven by rapid global expansion
- Long-term lease obligations with short-term customer contracts
- High fixed costs and low operating leverage
- Cash burn worsened as scale increased
- Growth funded by heavy debt and external capital
- Dependent on favorable capital markets to survive
My Stock Screener: Turning Philosophy Into Process
At the core of my hypergrowth framework is a simple idea:
Growth without margins is noise.
Margins without growth are stagnation.
Price-to-Gross-Profit balances both into a good stock screening metric.
| Rank | Company | EV / Rev | Gross Margin | Price / GP | Revenue Growth |
|---|---|---|---|---|---|
| 1 | Remitly | 1.5x | 59.5% | 2.5x | 31.3% |
| 2 | HubSpot | 4.4x | 84.1% | 5.2x | 19.2% |
| 3 | Adobe | 5.1x | 89.3% | 5.7x | 10.5% |
| 4 | Zeta Global | 3.6x | 60.8% | 5.9x | 35.9% |
| 5 | GitLab | 5.2x | 88.0% | 5.9x | 27.4% |
| 6 | Salesforce | 4.8x | 77.7% | 6.2x | 8.4% |
| 7 | The Trade Desk | 4.9x | 78.8% | 6.2x | 20.8% |
| 8 | Atlassian | 5.4x | 83.5% | 6.5x | 19.5% |
| 9 | Shift4Payment | 2.3x | 32.6% | 7.1x | 23.2% |
| 10 | Sezzle | 5.2x | 71.6% | 7.3x | 88.7% |
| 11 | Duolingo | 5.3x | 72.0% | 7.4x | 39.9% |
| 12 | Amazon | 3.8x | 50.0% | 7.6x | 11.5% |
| 13 | MercadoLibre | 4.3x | 50.4% | 8.5x | 36.9% |
| 14 | Grab | 3.6x | 41.4% | 8.7x | 20.2% |
| 15 | ServiceNow | 8.2x | 77.5% | 10.6x | 20.9% |
| 16 | Meta Platforms | 8.9x | 82.0% | 10.9x | 22.2% |
| 17 | Zscaler | 10.7x | 76.8% | 13.9x | 23.2% |
| 18 | Netflix | 8.0x | 48.5% | 16.5x | 15.9% |
| 19 | Vertiv | 7.5x | 35.7% | 21.0x | 28.8% |
5 Stock Pick of Jan 2026
Making my stock pick!
After running my stock screener and doing the work, only a small subset remained.
Out of the full list, 6 companies passed both my quantitative screen and qualitative checklist.
This wasn’t about finding the “best” stocks.
It was about identifying businesses that met my standards for durable hypergrowth.
Stock pick #1 HubSpot
| Question | Explanation |
|---|---|
| Is there real revenue growth? | Yes. Revenue continues to grow at a healthy rate, driven by organic demand rather than acquisitions. Growth has moderated with scale but remains durable. |
| What are the long-term tailwinds? | Structural SMB digitization, global CRM underpenetration, shift from point tools to integrated platforms, and productivity gains from automation and AI. |
| Will revenue still grow in 5 years? | Likely yes, at mid-teens rates. Growth increasingly comes from selling more hubs, seats, and features to existing customers rather than relying only on new customer adds. |
| Are customers sticky? | Yes, economically. As customers adopt multiple hubs, HubSpot becomes embedded in core workflows, increasing switching costs. |
| What does retention look like? | SMB churn exists, but net revenue retention above 100% shows expansion revenue offsets churn. Retention improves as customers grow and deepen usage. |
| Are unit economics strong? | Yes. Gross margins remain around 80%, indicating pricing power and scalability. Older cohorts generate strong lifetime value. |
| Why hasn’t sales & marketing % declined? | By choice. Management reinvests efficiency gains into growth and market expansion rather than optimizing margins prematurely. |
| Is sales & marketing an investment or a tax? | An investment. Expansion revenue requires low incremental CAC, and growth spend could be pulled back quickly to expand margins if needed. |
| Is there operating leverage? | Yes, but intentionally delayed. Free cash flow margins are improving, and margin expansion is available if growth slows. |
| What is the moat? | Moderate but widening: brand trust with SMBs, integrated all-in-one platform, ecosystem partners, and workflow + data lock-in. |
| What could break the thesis? | Prolonged SMB recession, failure to drive multi-hub expansion, or a superior low-cost AI-native CRM winning SMBs at scale. |
| Overall assessment | A disciplined SaaS compounder — not a speculative hypergrowth stock, but a business built for steady, long-term value creation. |
Stock pick #2 Adobe
| Question | Explanation |
|---|---|
| Is there real revenue growth? | Yes. Adobe continues to grow revenue steadily, though at a slower pace than earlier years, reflecting its large scale and mature market position. Ai disruption is real especially to lower end content creators , the professional will still continue using adobe and even use adobe ai tools. AI features embedded inside Adobe tools are more valuable than standalone AI outputs. As a critical investor, you should believe: ❌ Adobe is not immune to AI disruption ✅ Core professional and enterprise revenue is still defensible ⚠️ Growth and margins may face pressure at the edges ⚠️ Valuation should reflect some AI uncertainty, not perfection |
| What are the long-term tailwinds? | Structural shift toward digital content creation, cloud-based creative tools, digital marketing, and document workflows across enterprises and individuals. |
| Will revenue still grow in 5 years? | Likely yes, at high-single to low-double-digit rates, driven by price increases, upsells, AI features, and continued migration to cloud subscriptions. |
| Are customers sticky? | Extremely sticky. Adobe products are industry standards embedded in professional workflows, making switching costly and disruptive. |
| What does retention look like? | Very high retention across creative professionals and enterprises; subscriptions renew consistently with low churn. |
| Are unit economics strong? | Yes. Adobe has very high gross margins, strong operating margins, and generates substantial free cash flow. |
| Sales & marketing efficiency | Highly efficient. Adobe does not need aggressive S&M spend due to brand dominance and entrenched customer base. |
| Is sales & marketing an investment or a tax? | Mostly maintenance-level investment; growth is driven more by pricing power and product expansion than heavy customer acquisition. |
| Is there operating leverage? | Yes, clearly demonstrated. Revenue growth translates efficiently into operating income and free cash flow. |
| What is the moat? | Very strong moat based on industry standardization, switching costs, ecosystem lock-in, file formats, and brand dominance. |
| What could break the thesis? | Major disruption in creative workflows, regulatory pressure on pricing, or a successful low-cost alternative reaching professional-grade quality. |
| Overall assessment | A high-quality software stalwart — less of a hypergrowth play, more of a durable cash-flow compounder with strong pricing power. |
Stock pick #3 Remitly
| Question | Explanation |
|---|---|
| Is there real revenue growth? | Yes. Revenue has been growing ~20–30%, driven by increasing send volume and active customers. Growth is organic and usage-led, not acquisition-driven. |
| What are the long-term tailwinds? | Structural global migration, rising remittance flows, shift from cash-based to digital transfers, and increasing smartphone adoption in emerging markets. These are multi-decade trends. |
| Will revenue still grow in 5 years? | Likely yes, but growth depends on continued volume expansion and product cross-sell. Growth may moderate as the company scales and competition intensifies. |
| Are customers sticky? | Moderately sticky. Remittances are habitual, repeat-use products, but switching costs are lower than SaaS since users can easily compare fees across apps. |
| What does retention look like? | Retention is driven by trust, reliability, and pricing rather than deep workflow lock-in. Customers stay if Remitly remains fast, cheap, and reliable. |
| Are unit economics strong? | Improving, but structurally weaker than SaaS. Gross margins are lower due to FX spreads, payment rails, fraud, and compliance costs. |
| Why hasn’t sales & marketing % declined much? | Customer acquisition remains competitive. Marketing is required to defend share against Wise, PayPal/Xoom, Western Union, and regional players. |
| Is sales & marketing an investment or a tax? | Partly investment, partly tax. CAC can pay back over time due to repeat usage, but competitive pressure limits how much efficiency improves. |
| Is there operating leverage? | Emerging, but not guaranteed. Some operating leverage appears as scale improves, but margins will likely cap below pure software businesses. |
| What is the moat? | Narrow moat. Trust, brand, regulatory licenses, payout network, and reliability matter—but switching costs are limited and price competition is real. |
| How is growth funded? | Increasingly through internal cash generation, but historically involved dilution and SBC. Needs monitoring to ensure growth becomes self-funded. |
| What could break the thesis? | Fee compression from competition, rising compliance/fraud costs, slower migration flows, or inability to expand beyond core remittances. |
| Overall assessment | A fintech growth story, not a SaaS compounder. Strong tailwinds and usage growth, but thinner margins, higher competition, and weaker moats than software peers. |
Stock pick #4 Shift Four
| Question | Explanation |
|---|---|
| Is there real revenue growth? | Yes. Revenue growth has been strong, driven by increasing payment volumes, merchant wins, and expansion into new verticals. Growth is partly organic and partly supported by acquisitions. |
| What are the long-term tailwinds? | Secular shift from cash to digital payments, growth in card-not-present transactions, and increasing software penetration in vertical-specific commerce (hospitality, restaurants, venues). |
| Will revenue still grow in 5 years? | Likely yes, but growth will normalize. Expansion depends on continued merchant acquisition, higher transaction volumes, and cross-selling software and value-added services. |
| Are customers sticky? | Moderately sticky. Once embedded into a merchant’s POS, payments stack, and integrations, switching is painful—but not impossible if pricing or service degrades. |
| What does retention look like? | Retention is strong in core verticals like hospitality due to integration complexity, but churn risk exists for smaller merchants sensitive to fees. |
| Are unit economics strong? | Reasonably strong but not SaaS-like. Gross margins are constrained by interchange and network fees, though software and value-added services improve blended margins. |
| Why hasn’t sales & marketing % declined much? | Growth requires continuous merchant acquisition and vertical expansion. Competition is intense, so go-to-market spend remains necessary. |
| Is sales & marketing an investment or a tax? | Mostly an investment. Large merchants and enterprise venues have long lifetimes, but pricing pressure limits how much CAC efficiency improves. |
| Is there operating leverage? | Yes, but capped. Scale improves margins, especially through software attach, though margins will not approach pure software businesses. |
| What is the moat? | Narrow-to-moderate moat. Strength comes from vertical focus, deep integrations, enterprise relationships, and switching friction—not from network effects. |
| How is growth funded? | Combination of internal cash flow and balance-sheet leverage. Past acquisitions increased debt; capital discipline is critical going forward. |
| What could break the thesis? | Fee compression, merchant churn during downturns, integration risk from acquisitions, or aggressive pricing from larger payment processors. |
| Overall assessment | A payments compounder with operational leverage, but structurally lower margins and higher competition than SaaS. Execution and capital discipline matter more than pure growth. |
Stock pick #5 TDD
| Question | Explanation |
|---|---|
| Is there real revenue growth? | Yes. Revenue has compounded at ~20–30% historically, driven by rising programmatic ad spend and market share gains. Growth is organic and usage-driven. |
| What are the long-term tailwinds? | Shift from linear TV → Connected TV (CTV), growth of programmatic advertising, advertisers demanding transparency, and the open internet gaining share vs walled gardens. |
| Will revenue still grow in 5 years? | Likely yes, but growth will moderate. CTV penetration and international expansion support growth, but ad cycles are inherently cyclical. |
| Are customers sticky? | Yes. Agencies and large advertisers integrate TTD deeply into planning, bidding, and measurement workflows. Switching costs are meaningful at scale. |
| What does retention look like? | Extremely strong. Customer retention >95%, and spend per customer grows over time as budgets scale on the platform. |
| Are unit economics strong? | Yes. High gross margins, minimal capex, and software-like economics despite being tied to ad spend volumes. |
| Why hasn’t sales & marketing % declined much? | TTD reinvests heavily in product, data, and global expansion. Growth is driven more by product superiority than aggressive sales spend. |
| Is sales & marketing an investment or a tax? | Investment. Incremental revenue scales efficiently as large customers expand spend with little incremental CAC. |
| Is there operating leverage? | Yes, clearly demonstrated. As revenue scales, operating margins and free cash flow expand meaningfully. |
| What is the moat? | Strong but non-absolute moat: neutral platform positioning, deep agency relationships, data integrations, and trust as an independent player. |
| How is growth funded? | Entirely through internal cash flow. No reliance on debt or dilution; balance sheet is very strong. |
| What could break the thesis? | Ad market downturns, regulatory pressure on data/targeting, loss of open-internet relevance, or walled gardens closing off access further. |
| Overall assessment | A high-quality ad-tech compounder with exceptional retention and economics, but inherently exposed to advertising cycles and valuation risk. |
(Optional Gitlab!)
| Question | Explanation |
|---|---|
| Is there real revenue growth? | Yes. Revenue continues to grow at mid-20%+, driven by organic adoption, seat expansion, and enterprise usage. Growth is not acquisition-driven. |
| What are the long-term tailwinds? | Structural growth in software development, DevOps adoption, CI/CD automation, cloud-native architectures, DevSecOps, and distributed engineering teams. |
| Will revenue still grow in 5 years? | Likely yes. Growth can come from enterprise penetration, seat expansion, and upselling higher-tier plans. Monetization is still early relative to adoption. |
| Are customers sticky? | Yes. GitLab is embedded in mission-critical developer workflows (repos, CI/CD, security). Switching becomes costly once pipelines are integrated. |
| What does retention look like? | Strong net revenue retention driven by expansion within existing customers as usage deepens across the software lifecycle. |
| Are unit economics strong? | Yes. Gross margins around ~88%, indicating SaaS-quality scalability. Expansion revenue carries low incremental CAC. |
| Why hasn’t sales & marketing % declined? | By choice. GitLab is investing aggressively in enterprise go-to-market and platform breadth while growth remains high. |
| Is sales & marketing an investment or a tax? | An investment. Enterprise customers have long lifetimes, and expansion improves LTV/CAC over time. |
| Is there operating leverage? | Yes, but intentionally delayed. If growth spend slowed, margins could expand meaningfully. |
| What is the moat? | Moderate but real: integrated DevOps platform, developer lock-in, workflow depth, and open-core adoption funnel. Not a monopoly. |
| What could break the thesis? | Strong competition from GitHub/Microsoft, slower enterprise adoption, pricing pressure, or failure to convert open-source users into paid tiers. |
| Overall assessment | A high-margin SaaS growth company with mission-critical usage and a long runway, but execution and competition must be monitored closely. |
Buy and Pray
I’ve started positions in all six.
Only time will tell if i made the right call.
I’ll keep reviewing these positions, while reminding myself that wild price swings are part of the hypergrowth package.
Wishing everyone well, and good luck to us all 😄
| Stock | Revenue Growth (5Y Outlook) | Customer Stickiness | Unit Economics | Moat Strength | Cyclicality | Overall Quality |
|---|---|---|---|---|---|---|
| Adobe | Low-double digits | Very high | Excellent (elite margins, FCF) | Very strong | Low | ⭐⭐⭐⭐⭐ |
| HubSpot | Mid-teens | High (SMB) | Strong, improving | Medium, widening | Low | ⭐⭐⭐⭐☆ |
| The Trade Desk | High-teens / low-20s | Very high | Excellent | Strong | High | ⭐⭐⭐⭐☆ |
| GitLab | Mid-20%+ | High | Excellent (88% GM) | Medium | Low | ⭐⭐⭐⭐ |
| Shift4 Payments | Low- to mid-teens | Medium-high | Decent, capped | Narrow-medium | Medium | ⭐⭐⭐ |
| Remitly | High-teens / 20%+ | Medium | Improving, thin | Narrow | Medium | ⭐⭐☆ |