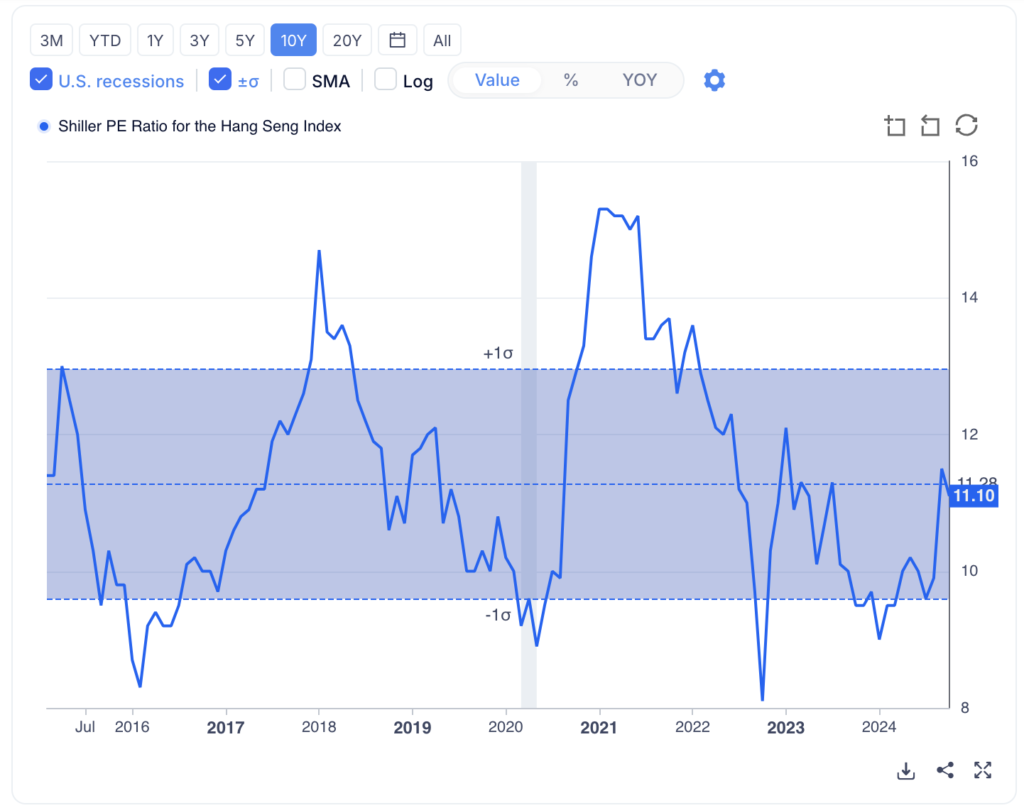
Using the Shiller PE ratio to determine if the markets of different countries are overpriced are underpriced?
The Us Market: ❌❌❌
It does seem like the U.S. market, particularly when looking at long-term valuations like the Shiller P/E (CAPE ratio) of 38.06, is historically on the higher end, suggesting potential overvaluation.
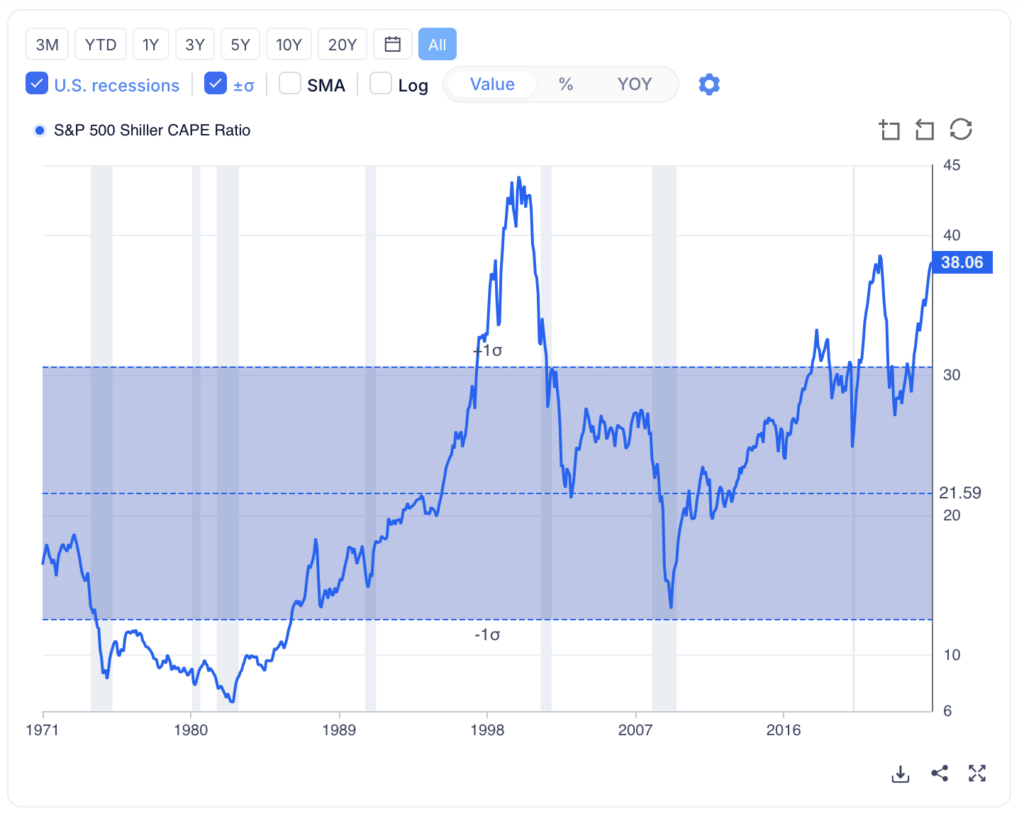
The average for this ratio is typically closer to 26 -30 times for 20years and 10years mean pe ratio, so anything above 30 can be a red flag that the market is expensive relative to earnings.
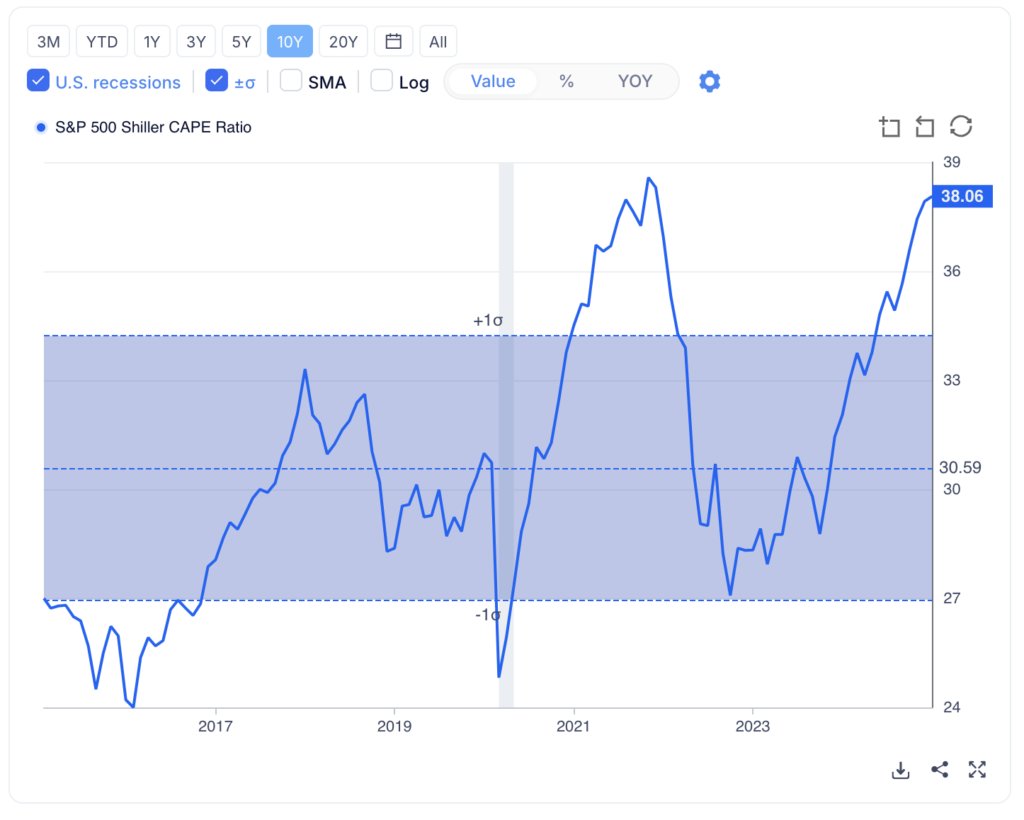

The shift from a more capital-intensive industry to a knowledge-based, software-focused economy has also contributed to the higher P/E ratios. Tech companies, especially those in emerging fields like artificial intelligence, tend to trade at premium valuations because investors expect higher future growth, even when current earnings might not fully reflect that potential.
As we can observe from below, PE trended between 8 – 20 from 1970s to 1980s. , it has progress towards 26 – 45 from 2000-2025
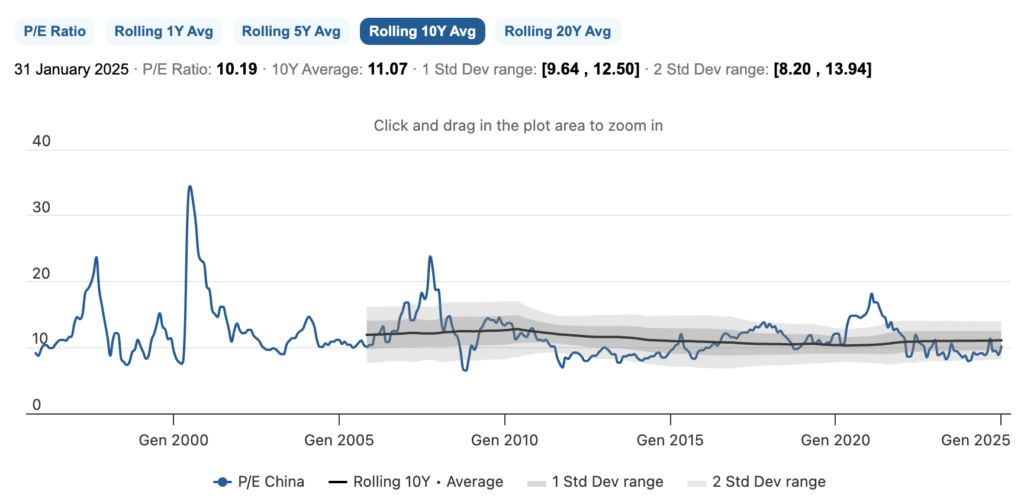
The Hk market: ✅✅
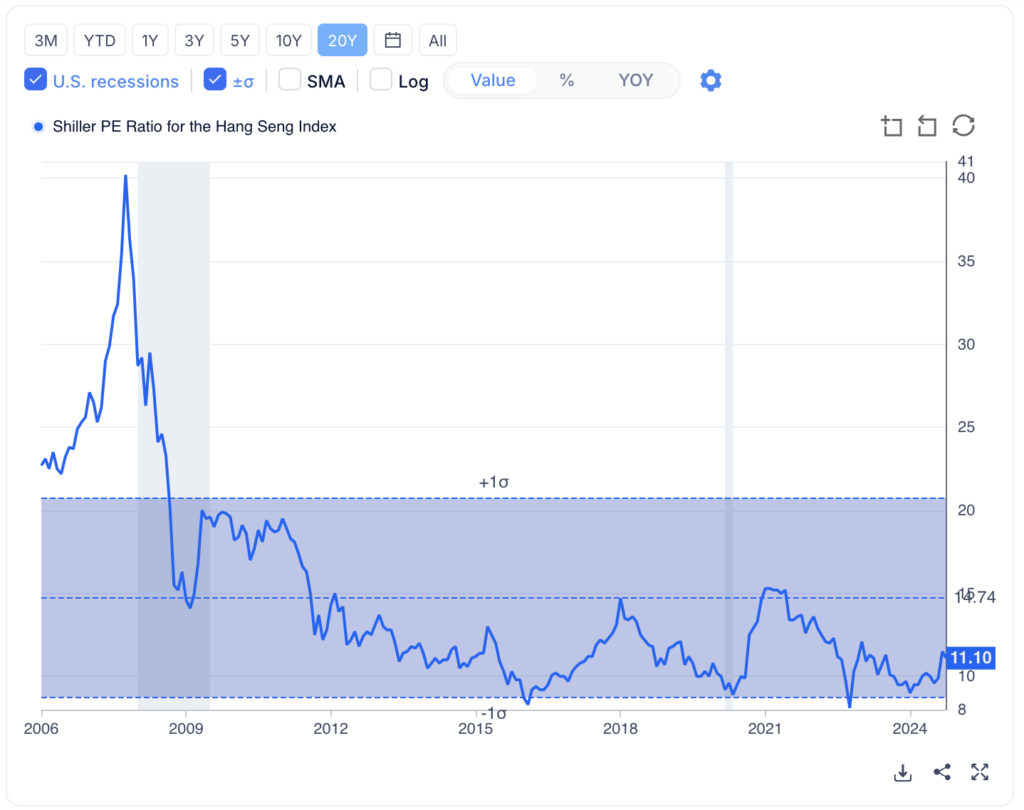
- The hang seng index does look relatively much cheaper compared to the us market.
- This does fall in line with the general view that china is currently in a deflationary cycle
The UK Market: ❌❌
- UK looks expensive too
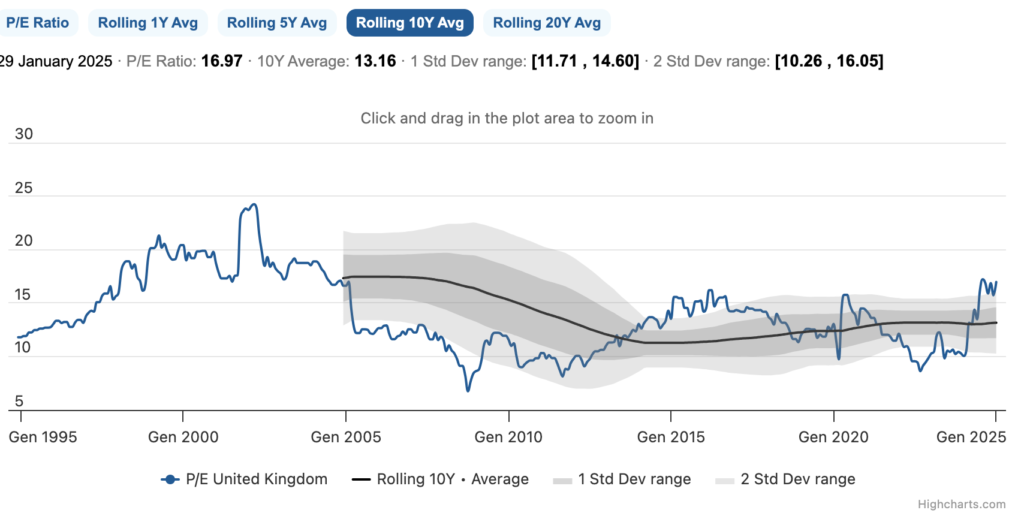
Source: https://worldperatio.com/area/united-kingdom/
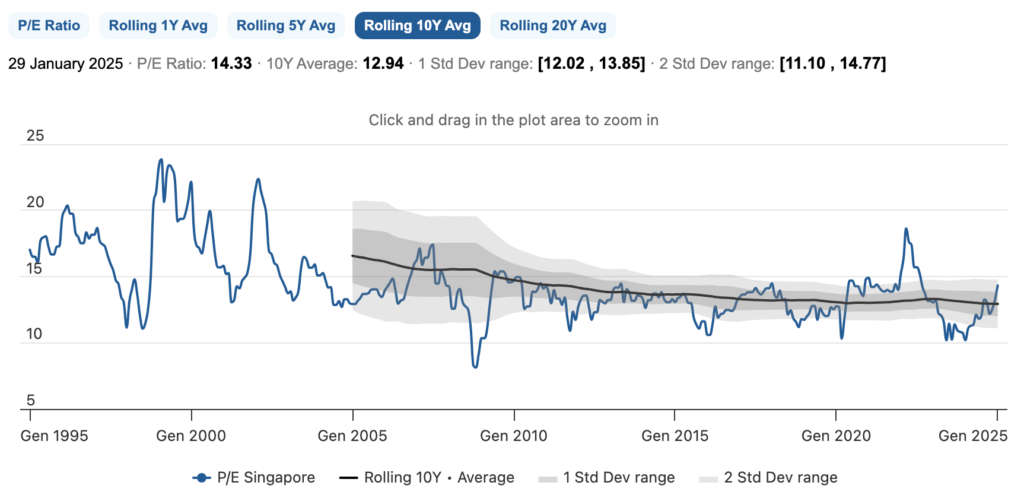
The Singapore Market ❌
- Just went past its 10 years avg of 12.04 pe ratio
- looks slightly overvalued
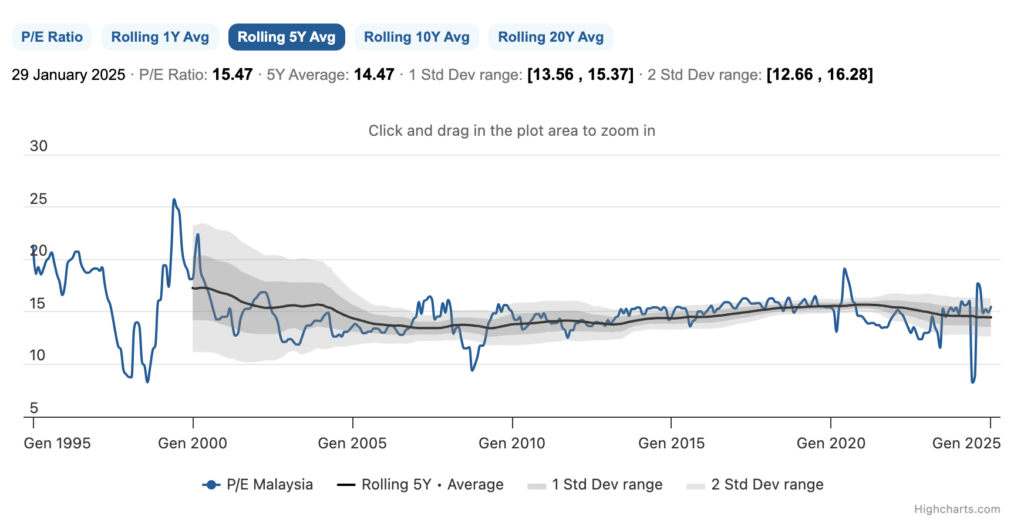
The Malaysia Market: ❓
- close to fair
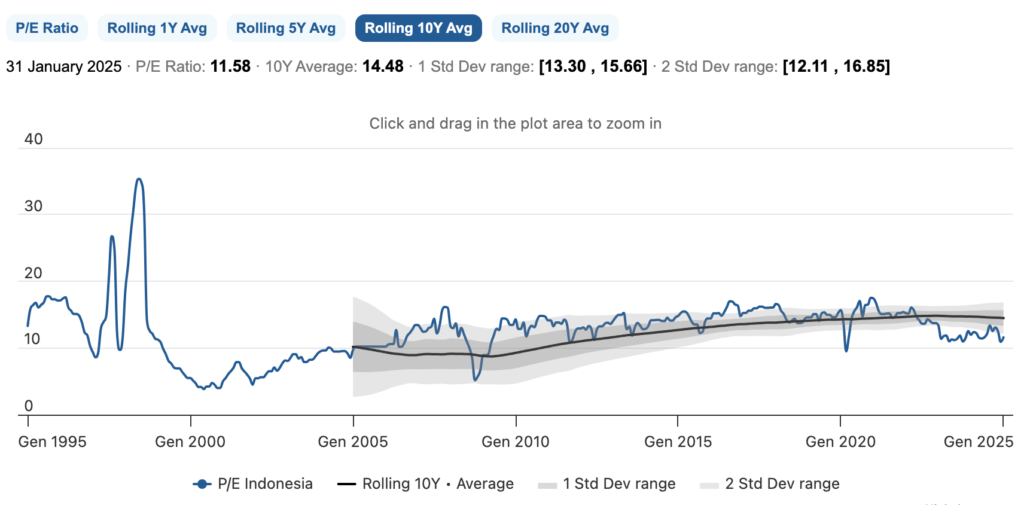
The Indonesia Market: ✅✅✅
My Country-Based Portfolio Allocation
My portfolio is currently distributed as follows:
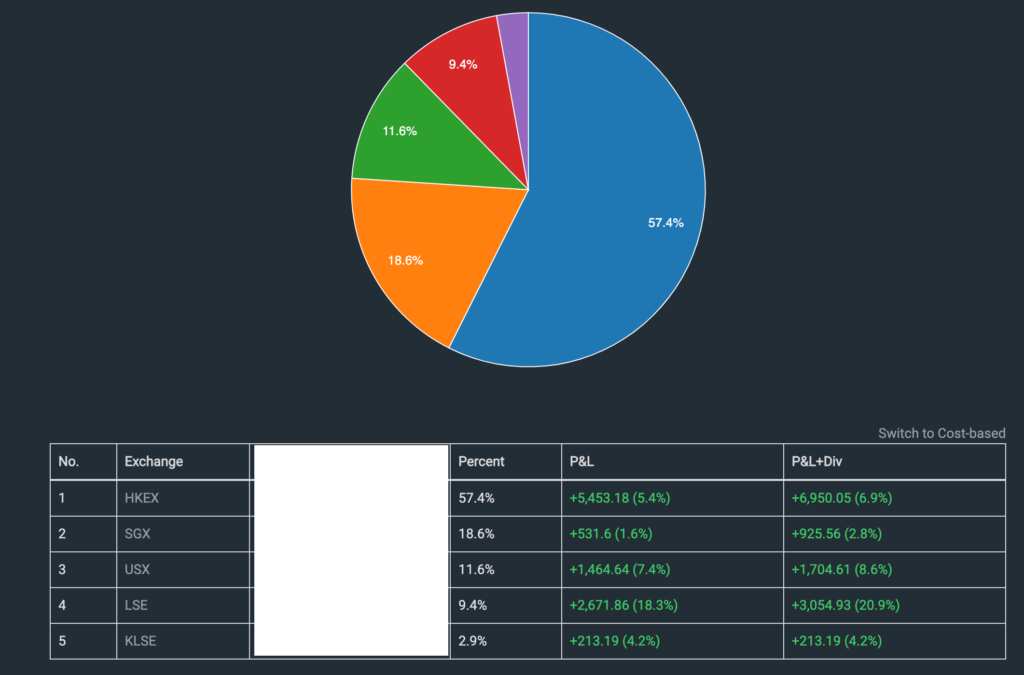
- Hong Kong (HKEX): 57.4%
- Singapore (SGX): 18.6%
- United States (USX): 11.6%
- London (LSE): 9.4%
- Malaysia (KLSE): 2.9%
The Appeal of Undervalued Markets
Undervalued markets often present attractive entry points for investors seeking growth at reasonable prices. Historical trends suggest that such markets may offer superior long-term returns as valuations eventually normalize. Currently, both the Hong Kong and Indonesian markets exhibit signs of being underpriced, making them intriguing options for investment consideration.
I already have a significant exposure to the hongkong market at 60% , which is i am relatively comfortable in but going beyond 60% might not be the best idea.
I might consider some exposure to the IDX the indonesia market, the capital gain tax is at 0.1% and the WTH is at 20%. Along with the depreciation of the rupiah , i remain on the fence on how to actually effectively gain exposure to the market.
The U.S. Market: A Long-Term Compounder
Taking a long-term view, the U.S. S&P 500 has consistently outperformed other markets over the years. Its strength lies in its resilience and ability to deliver steady growth, making it a cornerstone for many portfolios. However, this observation excludes dividends, which are a significant component of returns in other markets.
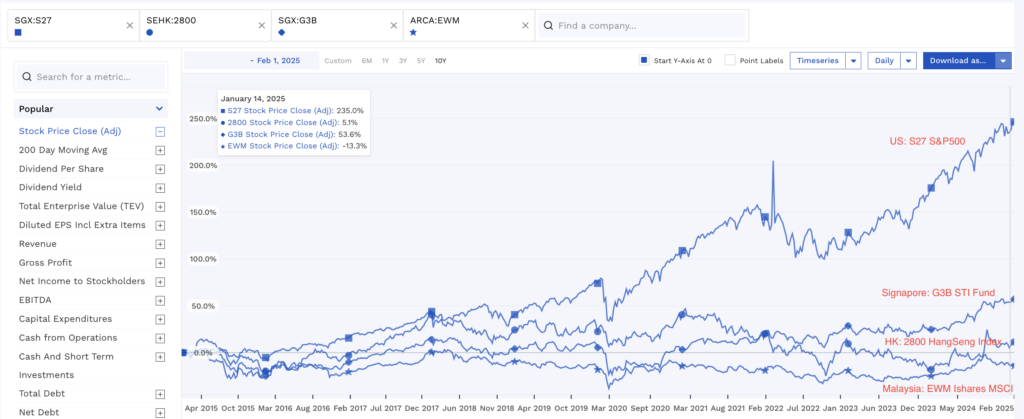
A Study into the US S&P500 ETF Markets 📈
The 2 options that we can use to gain exposure to the s&p500 on the London Stock Exchange (LSE) are:
1️⃣ VWRA – Vanguard FTSE All-World UCITS ETF 🌎
- Broad Global Allocation: Covers developed & emerging markets.
- Diversification: More balanced exposure beyond the U.S.
- Domicile: Irish-based (tax-efficient for some investors).
2️⃣ VUAA – Vanguard S&P 500 UCITS ETF 🇺🇸 (CSPX from Black Rock can consider too )
- Higher U.S. Concentration: Ideal for those bullish on the American market
- Tracks the S&P 500: Exposure to the largest U.S. companies.
- Irish-Domiciled: Lower withholding tax on dividends (15% vs. 30% for U.S.-domiciled ETFs).
I will be keeping a close eye on this and adding this as my long term portfolio.
Tips*
To determine if an ETF is U.S.-domiciled, you can check several key indicators: ( Avoid it to escape draconian 40% inheritance tax)
1. ISIN Code (Country Prefix)
The first two letters (“US”) indicate that the fund is registered in the United States.
The ISIN of iShares MSCI Indonesia ETF is US46429B3096.

